


The third quarter was softer than a year ago, but it was a slowdown, not a slide. Sales fell, permits fell, and notices of default rose. The year to date picture is steadier than the quarter alone suggests, and completed foreclosures stayed low. Here are the charts, from the Southern Utah Title Company numbers, with the history going back further than their report shows.
For homeowners, values have not fallen with sales. October's median sold prices held in both markets. For buyers, there is more choice and more time to decide. For sellers, pricing and presentation matter more now, and a longer time on the market should be expected.
Lot Sales
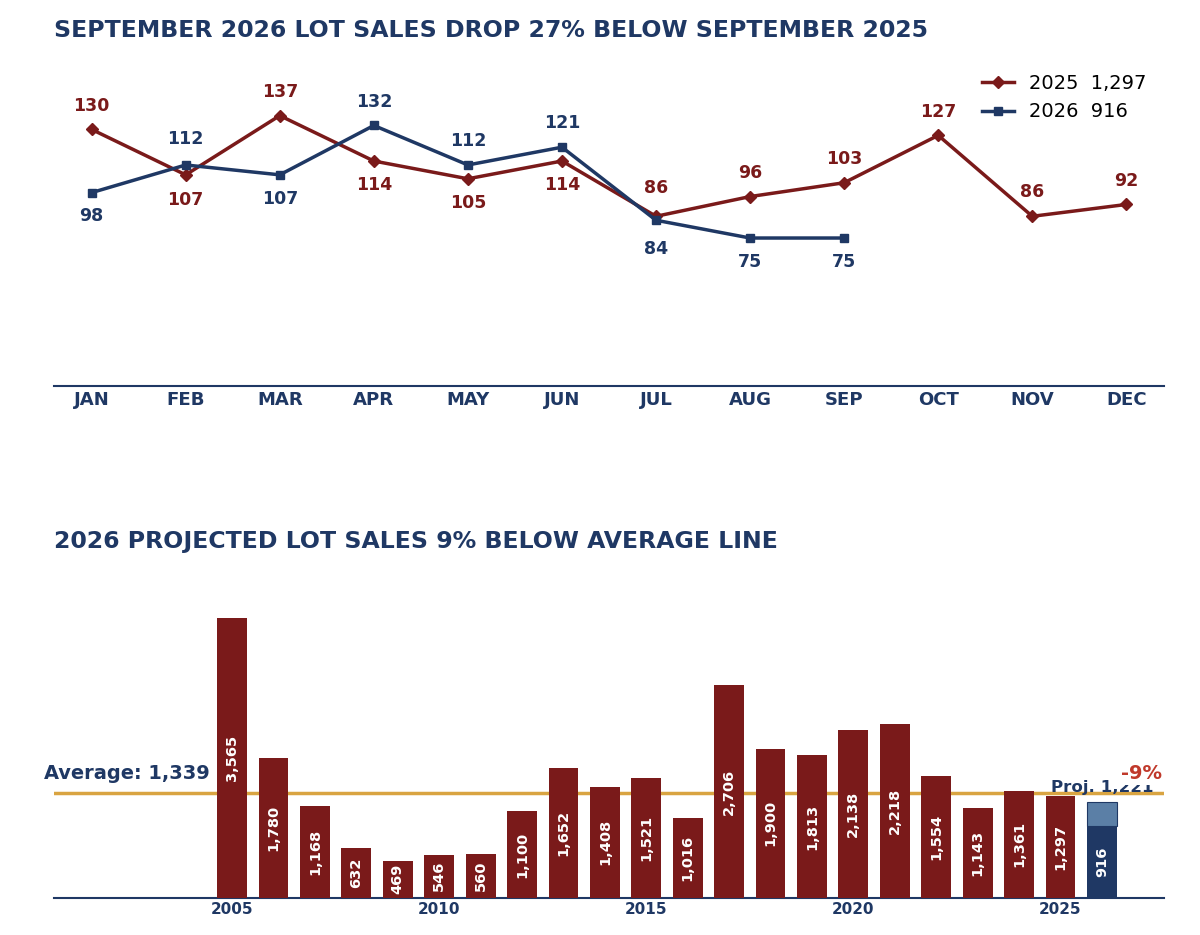
Lot sales were 234 in the third quarter, down 18% from a year ago. September was 75 against 103 last September. Through September, 916 lots have sold, and SUTC projects 1,221 for the full year, 9% below the 2022-2025 average of 1,339. The long view still belongs to 2005, when 3,565 lots sold in a single year.
Platted Lots
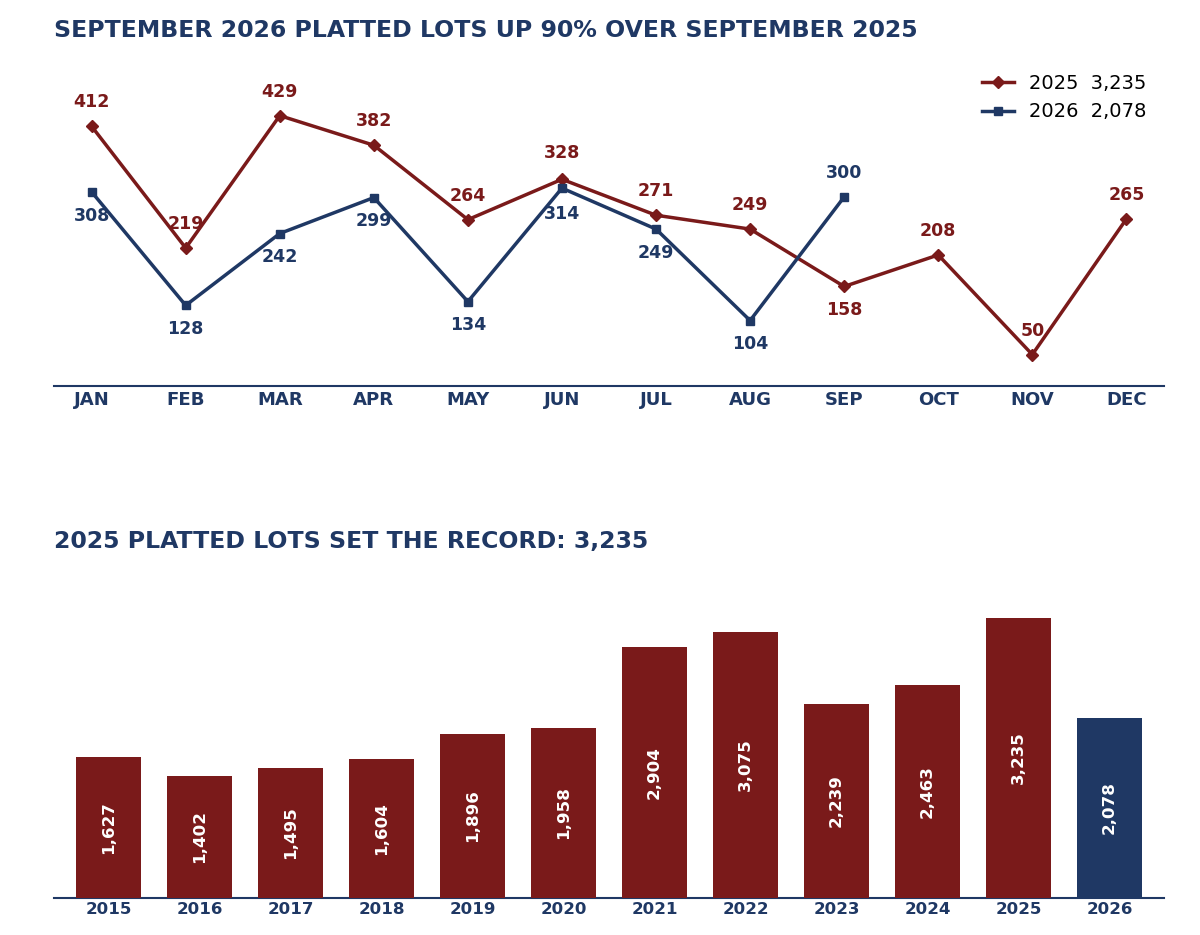
Platted lots were 653 in the quarter, down 4%. September was the strong month at 300, up 90% from last September. Through September, 2,078 platted lots are recorded, down 23% from the same months of 2025. The 2025 full-year total of 3,235 was the highest since this series began in 2015. A platted lot is a lot created by a recorded subdivision plat.
Building Permits
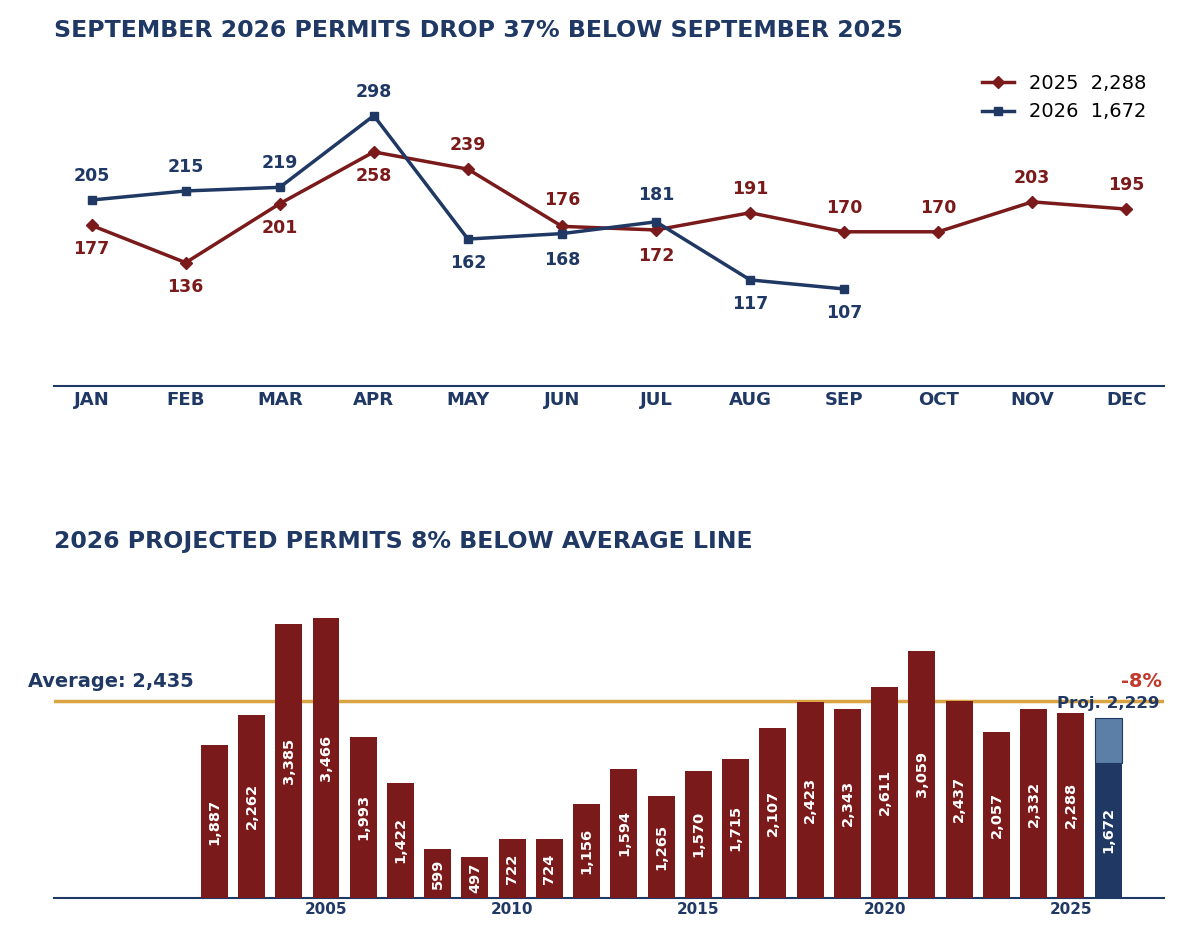
Permits were 405 in the quarter, down 24%, the largest percentage drop in the quarter. September was 107 against 170 last September. For the year to date, permits are down only 3%, so the third quarter carried most of the decline. SUTC projects 2,229 for the full year, 8% below the 2021-2025 average of 2,435. Fewer permits now can mean fewer new homes later.
New Home Sales
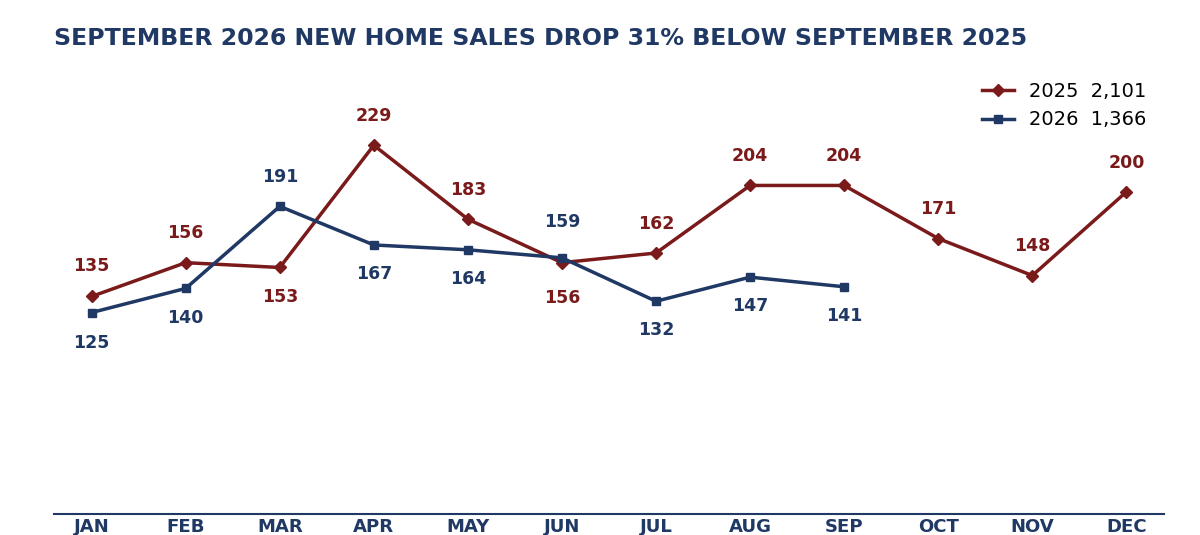
New home sales were 420 in the quarter, down 26%. September was 141 against 204 last September. Through September, 1,366 new homes have sold, down 14% from the same months of 2025.
Dwelling Sales
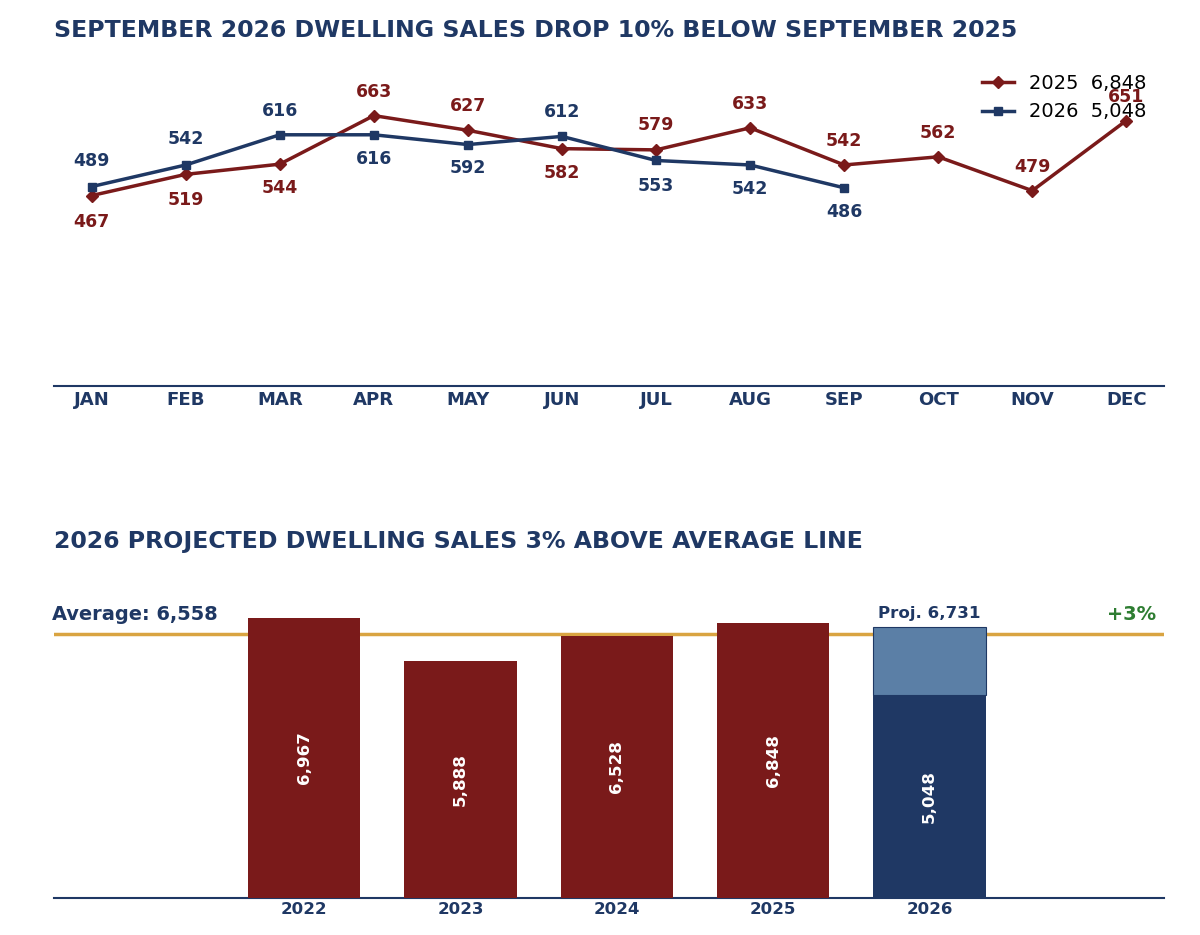
Dwelling sales were 1,581 in the quarter, down 10%. Through September, 5,048 dwellings have sold, down just 2%. SUTC projects 6,731 for the full year, 3% above the 2022-2025 average of 6,558. New dwellings made up 27% of dwelling sales through September, against 31% a year ago.
All Sales
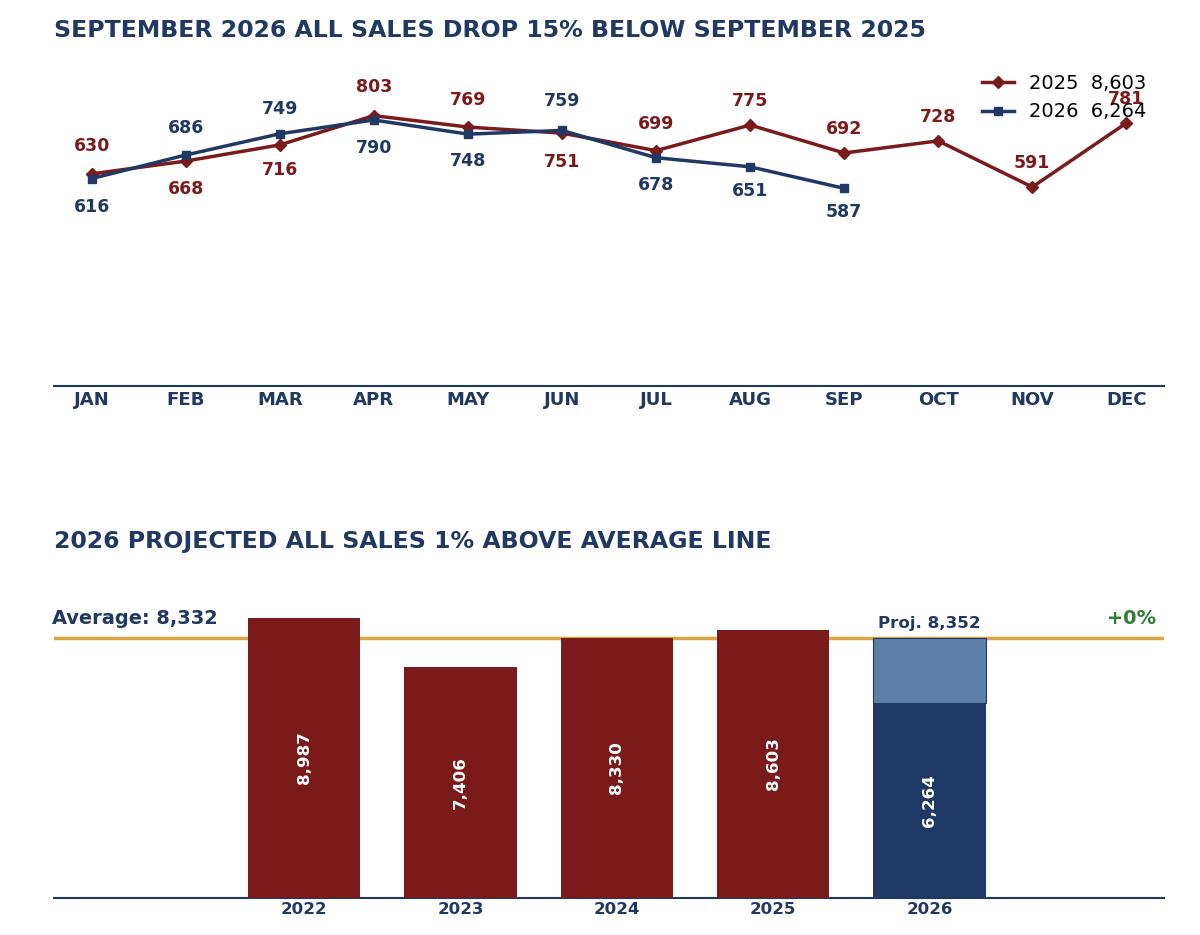
All sales were 1,916 in the quarter, down 12%. Through September, 6,264 sales of all types have closed, down 4%. SUTC projects 8,352 for the full year, about flat against the 2022-2025 average of 8,332.
All Sales by Segment
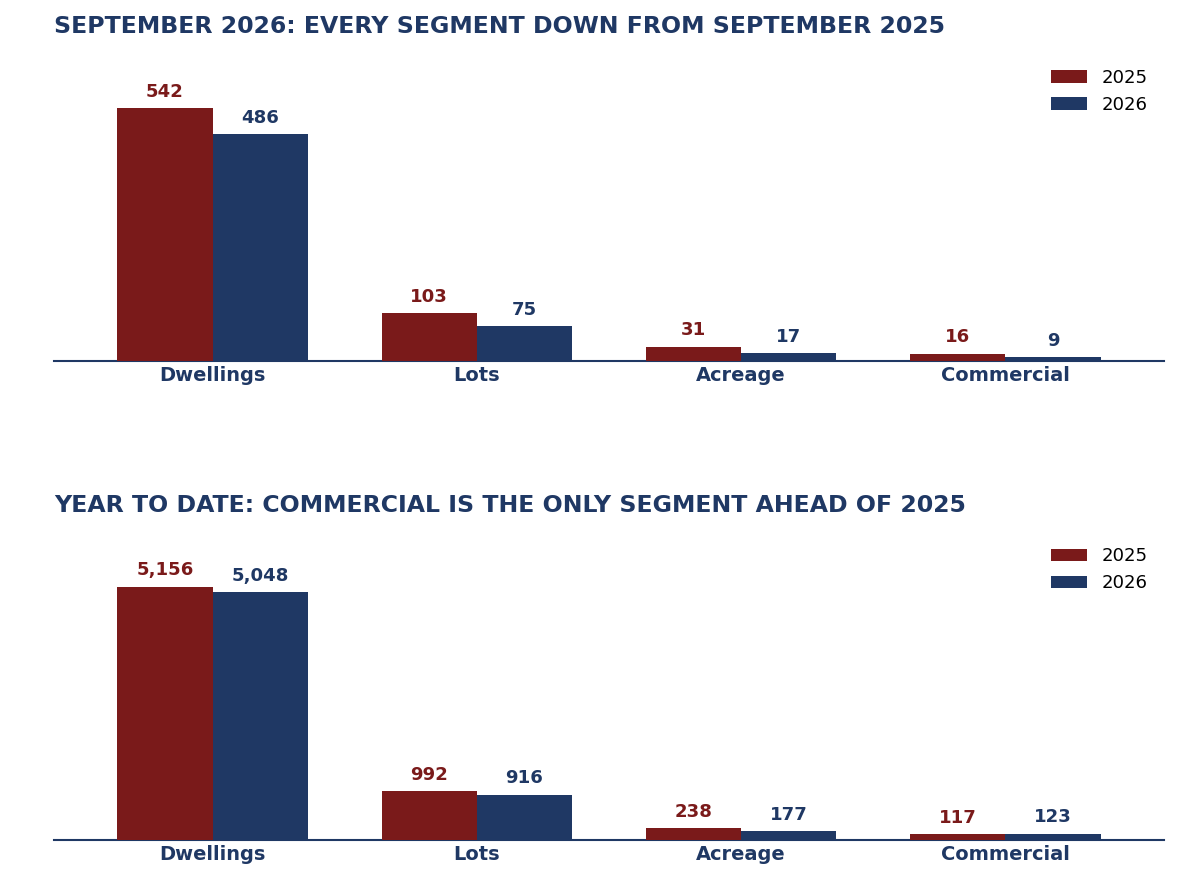
September was down in every segment: dwellings 486 against 542, lots 75 against 103, acreage 17 against 31, commercial 9 against 16. Year to date, commercial is the only segment ahead of last year, up 5% (123 against 117).
Where Sales Happened
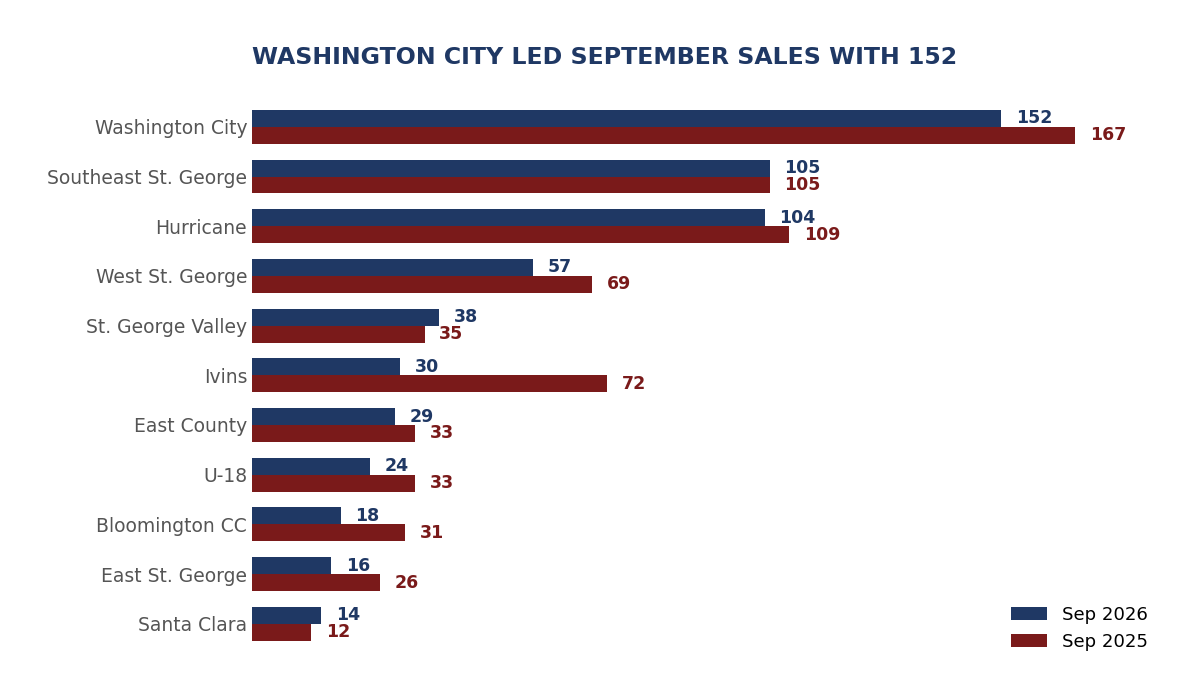
Washington City led September with 152 sales, followed by Southeast St. George with 105 and Hurricane with 104. Southeast St. George was the only area flat with last September; St. George Valley and Santa Clara were the only two areas ahead. Ivins fell the furthest, 30 against 72.
Notices of Default
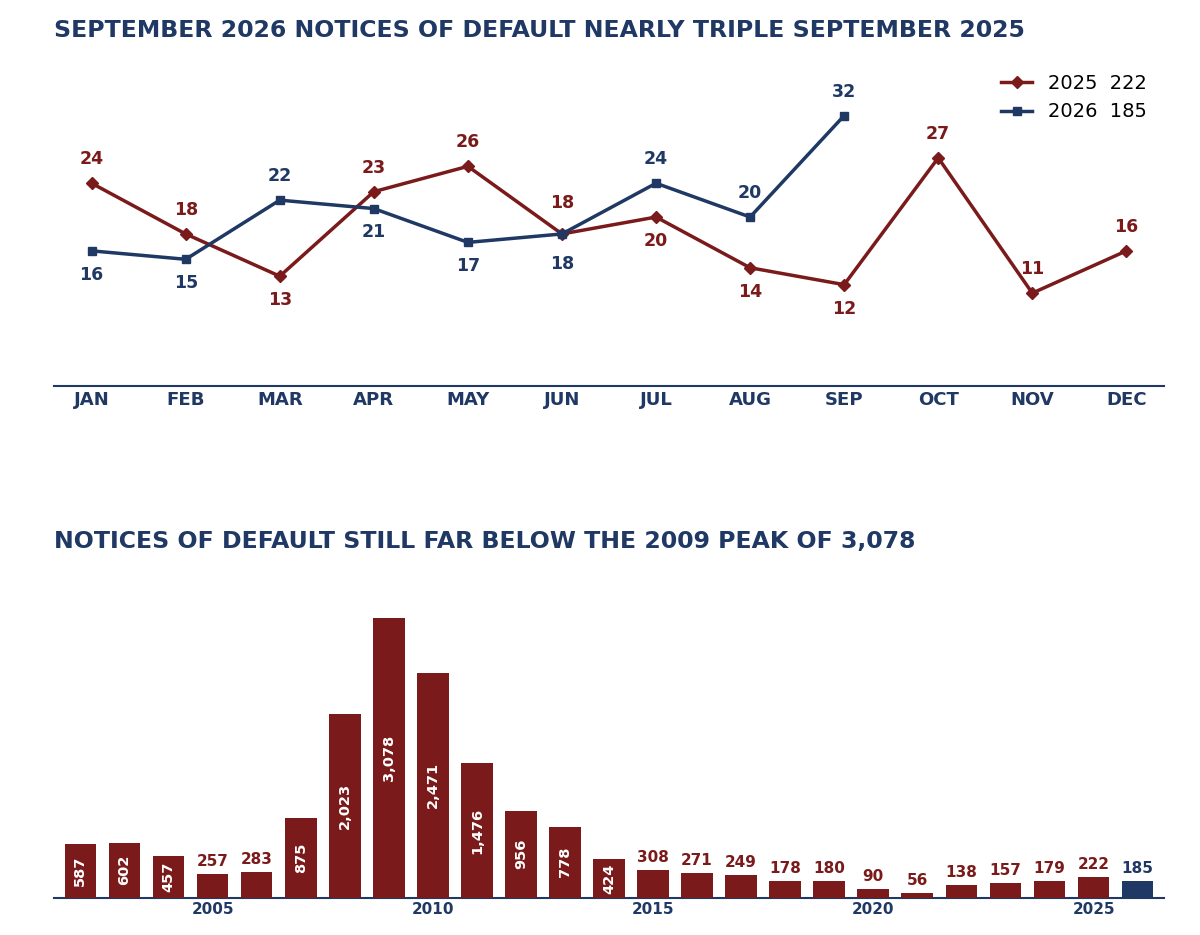
Notices of default were 76 in the quarter, up 65% from 46 a year earlier. September was the highest month of the year so far at 32, against 12 last September. Through September, 185 notices have been filed, up 10%. The count is still far below the 2008 to 2010 peak, when more than 2,000 notices a year were filed, with 3,078 in 2009 alone.
Trustee's Deeds (Foreclosures)
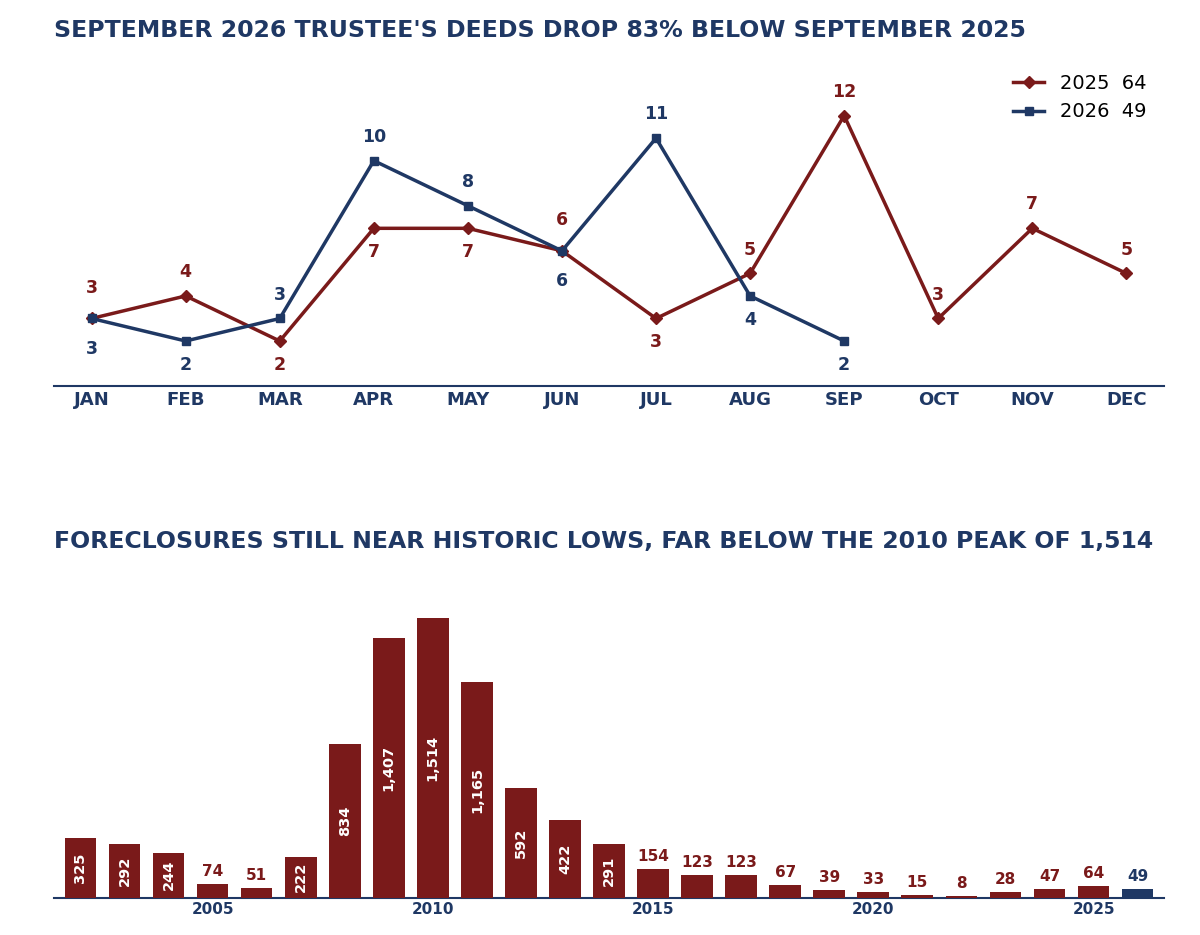
Trustee's deeds were 17 in the quarter, down 15%. September was 2 against 12 last September. Through September, 49 have been recorded, the same as last year. Foreclosures remain near historic lows, far below the 2010 peak of 1,514 in a single year. A notice of default is the start of the process; a trustee's deed is the completed foreclosure. The two counts are different stages and should not be added together.
The History of Interest Rates
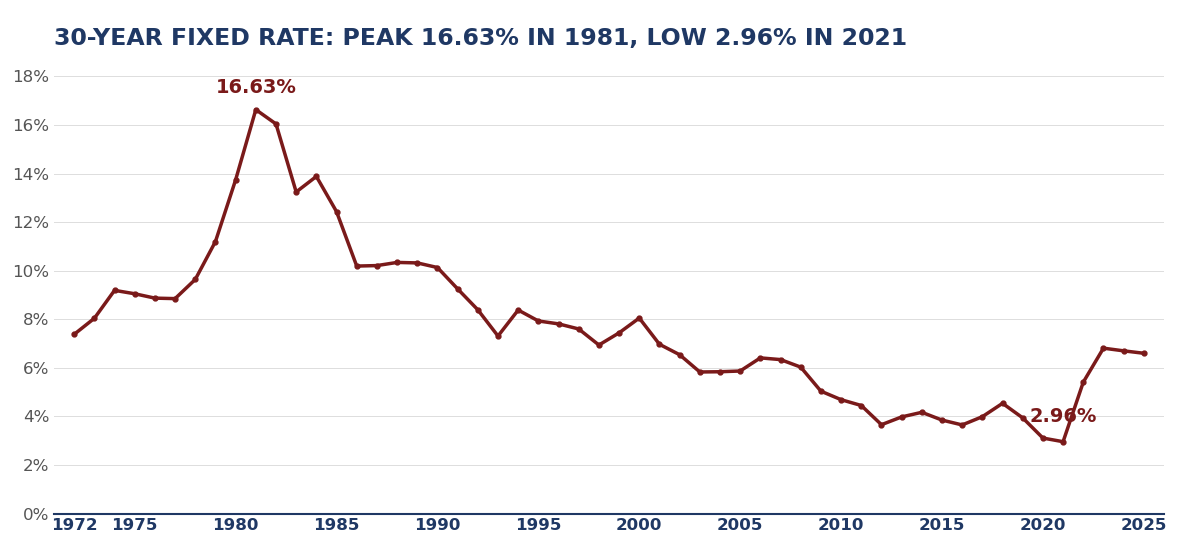
The average 30-year fixed rate by year, back to 1972. The peak was 16.63% in 1981. The low was 2.96% in 2021. The 2025 annual average was 6.60%. The current rate, kept separate: 7.18% for the week ending November 5, 2026, down from 7.24% the week before. That is a weekly rate, not an annual average.
How to read these charts
Completed years are in red. The 2026 bar is January through September only, in navy, with the SUTC projected full year in lighter blue where SUTC prints one. A partial year is never plotted as if it were a complete year. Projections are SUTC's: the January through September total multiplied by 12/9, which assumes the rest of the year runs at the same monthly pace. That is a straight-line estimate, not a forecast.
Sources: Southern Utah Title Company, Good News Housing Report, September 2026; Southern Utah Title Company, 2026 Q1 Market Statistics. Permit figures cover January through September 2026. SUTC compiled them on October 23, 2026, and notes that some cities had not yet reported their permits, so the figures may be amended as more reports come in.
Download the full 13-page report (PDF) for the tables behind these charts.