What the Q1 2026 Numbers Are Actually Telling Us About the Southern Utah Market
Every quarter we pull the data that most people never see. Not just home sales and median prices, but the deeper indicators that tell us where this market is actually headed. Building permits. Lot sales. Foreclosures. Notices of default. Interest rates over time.
Here is what Q1 2026 is telling us.
Click here to get the report
Lot Sales: Land Buyers Are Pulling Back
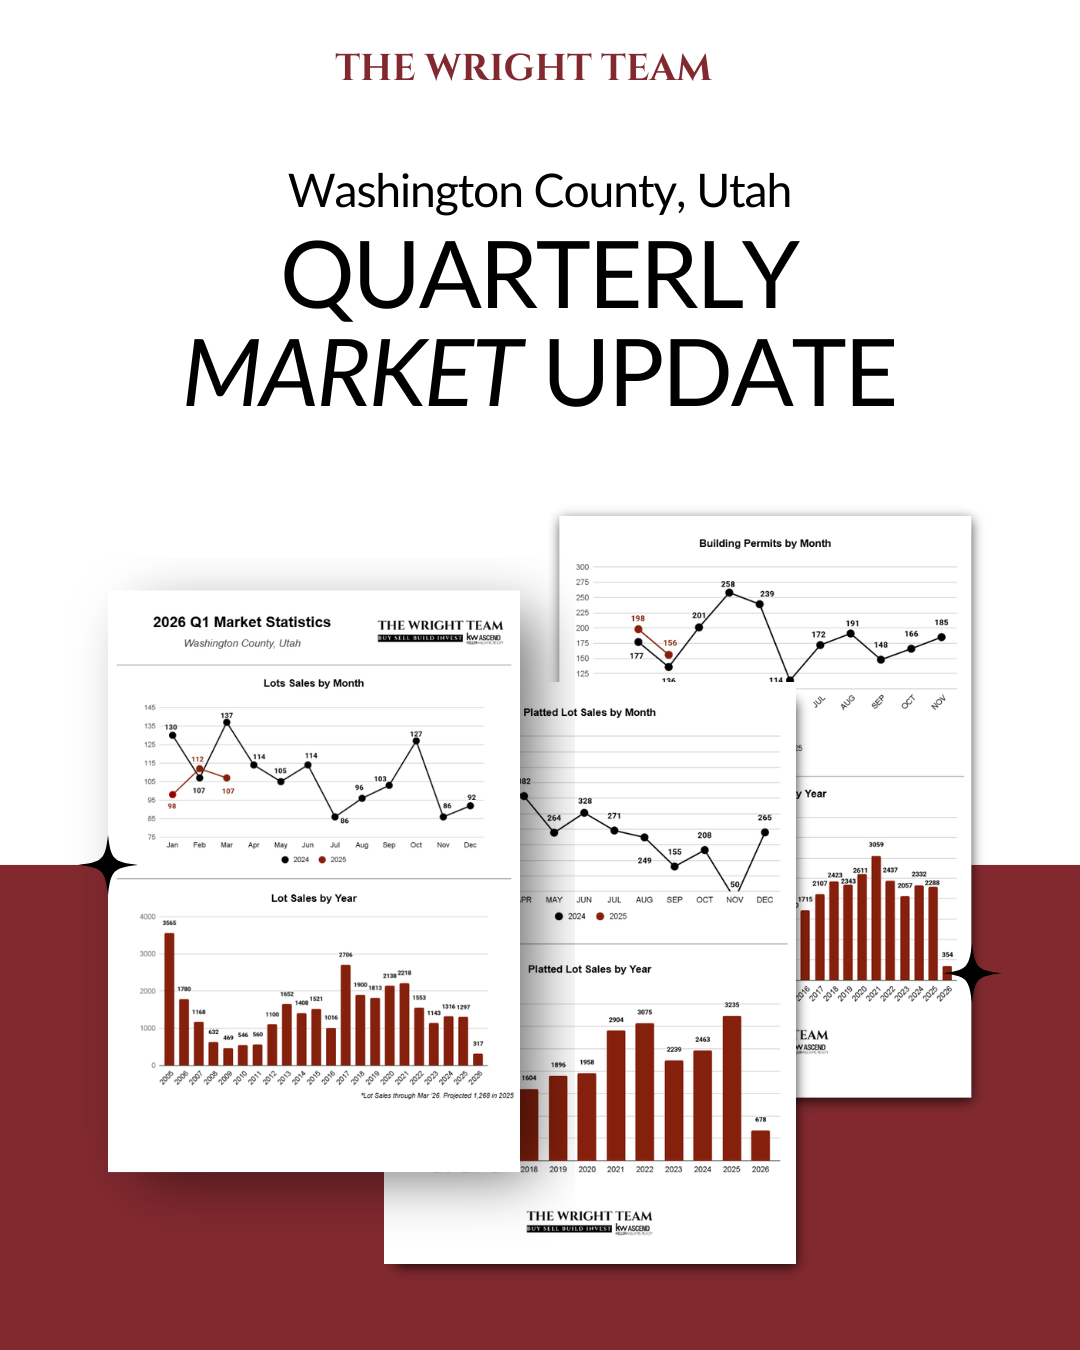
Total lot sales through Q1 2026 came in at 317, running well behind the pace set in 2025. Monthly numbers for January, February, and March all tracked below the same months in 2025, which recorded 130, 112, and 107 respectively compared to 98, 107, and 107 in 2026. Platted lot sales tell a similar story, with Q1 2026 at 678 versus a much stronger pace in 2025, which finished the year at a record-setting 3,235.
Land buyers and developers are being cautious and selective. They are not speculating the way they were during the peak years. That is not a red flag. That is a market maturing toward sustainable growth rather than runaway development.
Building Permits: Construction Activity Is Actually Holding Up
This one might surprise you. Building permits through Q1 2026 are actually running slightly ahead of the same period in 2025. January 2026 came in at 198 versus 177 in January 2025. February held at 156 compared to 136 the prior year. 354 total permits through Q1 2026 versus the same stretch in 2025.
Builders are still building. New construction activity in Washington County has not stalled. If anything, the early permit data suggests continued confidence in the Southern Utah market from the builder community.
Notices of Default: Historically Low and Staying There
Only 53 notices of default were recorded through Q1 2026. January came in at 16 versus 24 in 2025. February at 15 versus 18. March ticked up slightly to 22 versus 13, but the trend line remains historically low by any measure.
To put it in perspective, Washington County recorded over 3,000 notices of default in 2009 at the height of the last crisis. Today's numbers are not even a rounding error by comparison. Homeowners across Southern Utah are not in financial distress.
Foreclosures: Still at Historic Lows
Eight foreclosures through Q1 2026. January at 3, February at 2, March at 3, all tracking at or below the same months in 2025. During the 2009 to 2011 crisis, Washington County was recording over 1,400 foreclosures per year.
Anyone using the word crash to describe the current Southern Utah market is not looking at this data.
Interest Rates: Context Is Everything
Q1 2026 came in at 6.3%, down slightly from 6.60% in 2025 and 6.70% in 2024. That feels high to buyers who remember the 2.96% average in 2021. But zoom out and the picture changes entirely.
Rates averaged above 8% for most of the 1970s, 80s, and 90s. The sub-3% years were the anomaly, not the standard. At 6.3%, buyers are operating in a historically normal rate environment, and homes are still being bought and sold every single day across Washington County.
The Bottom Line
The Southern Utah market is recalibrating on the land side while construction activity holds steady and distress indicators remain at historic lows. This is not a market in trouble. It is a market finding its footing after an extraordinary run, and the fundamentals remain strong.
If you want to talk through what this means for your specific situation, whether you are buying, selling, or investing, we are here for that conversation.
Dusty Wright - The Wright Team at KW Ascend
Your Southern Utah Referral Partner 🤝
🏆 No. 1 Team at KW Ascend in 2025 | $110M+ Volume Closed
📍 St. George Born | Hurricane Raised | 18+ Years Experience Specializing in: Luxury, New Builds, RV Garages, Land & Development
👉 stgeorgeutahrealty.com | DM for Utah Referrals